Know what's happening with your equipment before anyone else does.

Sidekick is a non-invasive cellular sensor that monitors your HVAC equipment around the clock. The moment it's live, your whole team and your customers get a clear, real-time picture of what's healthy, what to watch, and what needs attention now.

Good
Running as expected
Watch
Trending off baseline
Elevated
Schedule service soon
Action
Needs attention now

Every view uses the same color system — from your full portfolio down to a single compressor.


Overview Page

Every location.
Five seconds.

Log in and your full portfolio is right there. Every site, color-coded. No digging, no calls to figure out if something's wrong.

One red site tells you exactly where to focus before your customer calls you.

10 East 38th Street
12 units monitored
Good
141 Flushing Ave
8 units monitored
Watch
90 Columbus Dr
5 units monitored
Elevated
340 W 11th Street
6 units monitored
Action Needed

Inside a Location

Every unit. Metrics that matter.

Drill into any location and you get a full equipment view across the site. Key metrics for every unit, updated continuously. If a compressor hasn't run when it should have, you'll see that too.

Unit Compressor Outlet Compressor Inlet ΔT Across Compressor Power per Cycle Cycle Duration
RTU-1 — Roof West 152.3°F 54.1°F +98.2° 5,810 W
6m
HP-3 — Floor 4 137.8°F 53.3°F +75.9° 5,894 W
10m
VRF-2 — Zone B 139.8°F 57.1°F +79.0° 2,576 W
12m
HP-5 — Lobby 141.2°F 55.8°F +76.9° 2,786 W
9m
AHU-1 — Basement Compressor last active 5 days ago

Individual Asset

Live data, right now.
And exactly where to look.

Go deeper into any unit and you get everything Sidekick is seeing in real time. Click any category to see the actual data and trends: discharge temp, suction temp, power draw, cycle length, and more.

RTU-1 — Roof West · Compressor
01
High discharge temp: 152°F
Normal range is 120–145°F. Outlet has been trending up for 48 hours. Four short cycles in under an hour. The pattern and the temperature together point to an issue that needs investigation.
02
ΔT across compressor: +98°
Well above expected range. Investigate alongside discharge temp.
HP-3 — Floor 4 · Refrigerant
01
Low suction temp: 38°F
Trending down over the past week. Normal is 45–60°F. Low suction temp is a classic low refrigerant charge signature. Caught early, this is a service call. Caught late, it could be a compressor failure.
02
Low discharge temp: 98°F
Suppressed outlet temp across multiple cycles signals an undercharge.
VRF-2 — Zone B · Electrical
01
Current draw: 14.2 A
Steady and within normal range. Power draw is consistent cycle over cycle. No load anomalies detected.
RTU-1 — Roof West · Operational
01
Short cycling: avg 4 min per cycle
Normal is 15+ minutes. 31 cycles logged today, well above baseline, and the trend has been worsening daily for a week. Each cycle cuts short before the unit can reach steady state, accelerating wear and signaling a deeper issue.
HP-5 — Lobby · Filter (Max platform)
01
Filter pressure: high
System is running inefficiently. Accumulation of particulate matter, debris, sludge, or contaminants is likely affecting compressor load. Last changed 5 months ago based on field notes.
02
Trend: increasing
Differential pressure is trending upward over the past 30 days.

Who Uses Sidekick

Same data. Different lens.

Sidekick works for everyone: from the dispatcher at the office to the building owner who just wants to know things are running.

Service Manager and Dispatcher
Your morning dashboard.

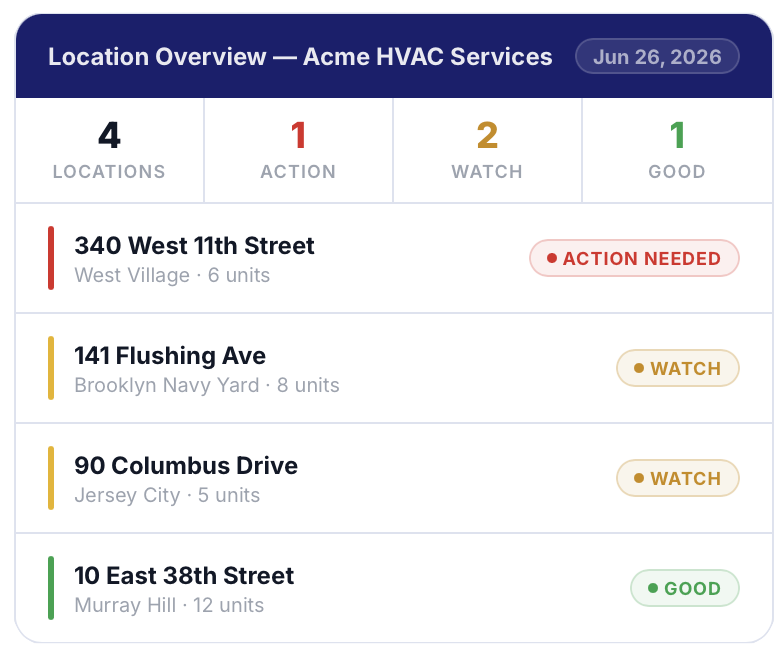
See every location, every unit, every flag before your phones start ringing. Know which sites need attention today and which ones don't.

  • Overview page: all locations at a glance
  • Equipment Stats: key metrics across the whole site
  • Share asset health directly with your tech or building owner
Service manager and dispatcher overview
Field Technician
Everything before you open the unit.

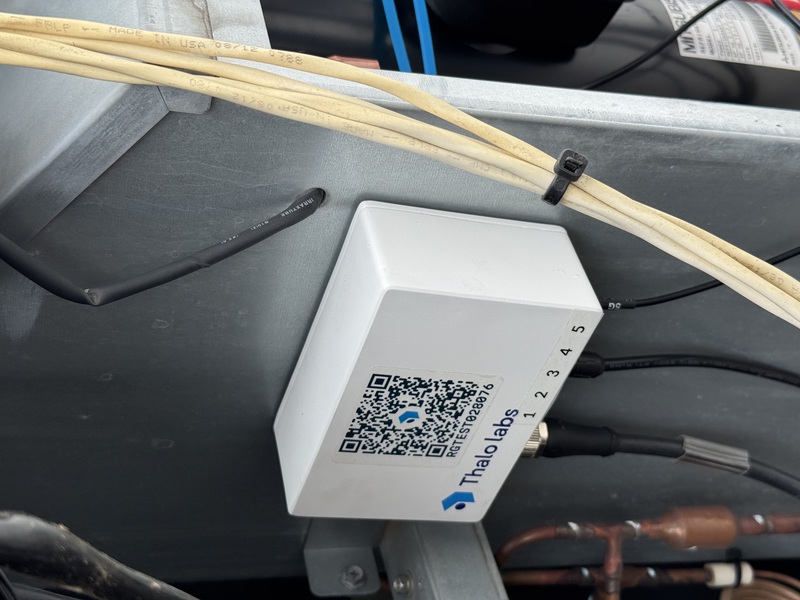
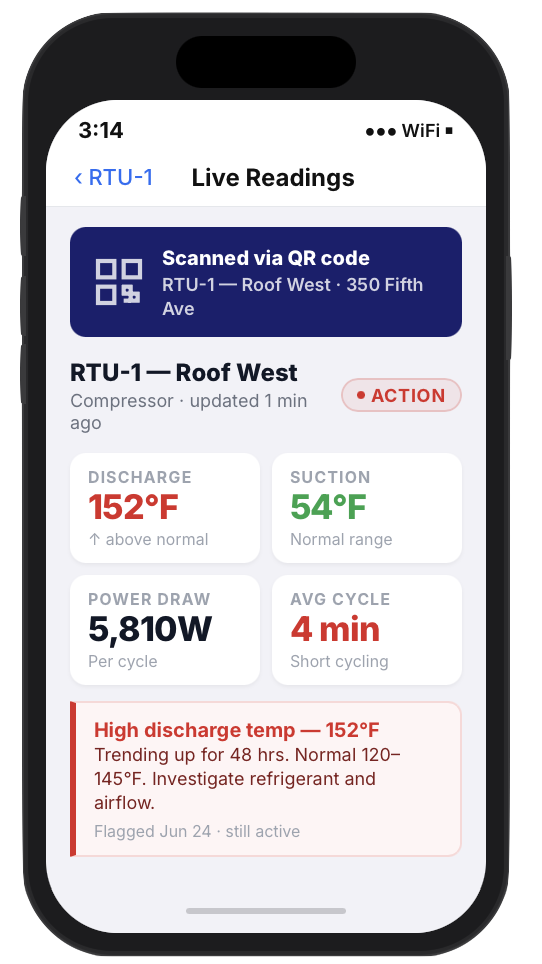
Scan the QR code on the Sidekick sensor and you're in. No app needed. See what's flagged, dive into live readings, and log your work when the job's done.

  • QR code access: instant asset health on your phone
  • Live discharge temp, suction temp, and power readings
  • Alert detail: what was flagged and when
  • Site visit log: document your work on site
Field technician mobile asset view
Building Owner and Property Manager
Visibility you've never had before.

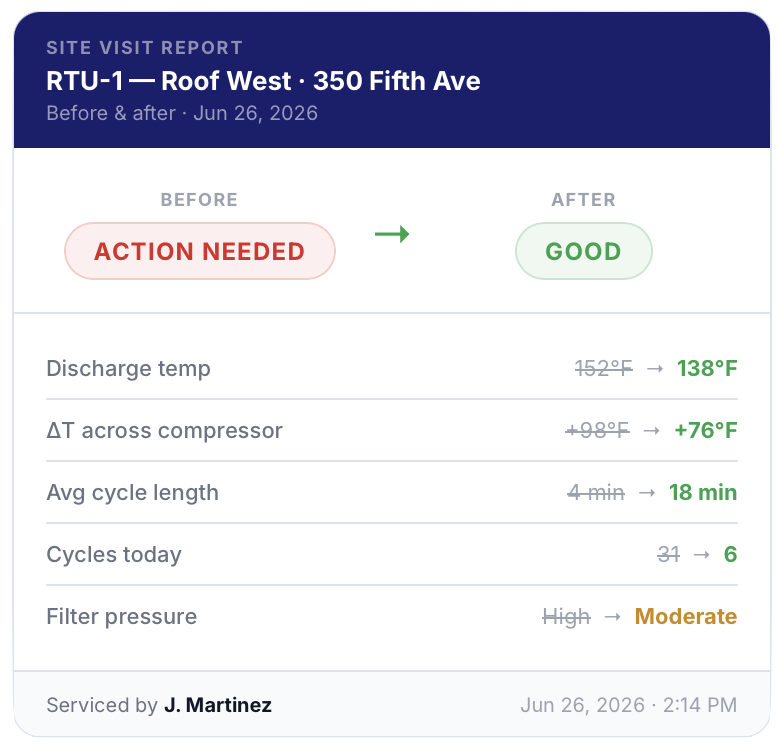
You don't need to understand HVAC to understand green, yellow, and red. When work happens, you get a before/after report showing what was found, what was fixed, and what changed.

  • Portfolio overview: all your equipment at a glance
  • Before/after reports: proof of work, every time
  • No HVAC expertise required
Building owner before/after report

What to Expect

Your first 30 days with Thalo.

Sidekick calibrates to your equipment because no two buildings are the same. Here's what you'll see from onboarding through your first month live.

Before Day 0
Onboarding: you're ready before Sidekick ships.

Your team gets a Thalo training session, you set your alert preferences, and you add your users. By the time the sensor arrives, everyone knows what they're looking at.

Thalo training Alert preferences User setup
Day 0
You're live: first location on the map.

Sidekick is installed. Your first location is on your overview page: every unit visible, color-coded, already monitoring. The clock starts now.

The sensor goes on in about 15 minutes. No rewiring, no Wi-Fi, no building systems access. Scan the QR code to link to your dashboard and it's live.

Sidekick sensor being installed on HVAC unit
Day 3
First health check: your baseline, in your inbox.

You get your post-install status update: a snapshot of every unit on site. What's running, what looks normal, what Sidekick is already watching. For most customers, it's the first time they've ever seen this data.

Day 7 or sooner
First flag: this is the moment.

Almost every customer sees their first real issue within the first week, something already happening before Sidekick showed up. You didn't go looking for it. Sidekick found it.

The difference between a $300 service call and a $6,000 compressor replacement is often just time.
Day 14
Baseline locked in: now you know what normal looks like.

Two weeks of data means Sidekick has a real baseline for your equipment. Not generic thresholds, but your compressors, your refrigerant charge, your electrical load. That's what makes the flags meaningful.

By now you're also getting your summary email every morning or once a week, your choice. It's a quick view of every location and any changes since the previous email.

From: Copilot <[email protected]>
Subject: Daily Summary — Jun 21, 2026
Sun, Jun 21 at 9:00 AM
Thalo Labs
Daily Summary
Jun 21, 2026
Acme HVAC Services ›
3
Locations
14
Assets
1
Critical
2
Warning
Asset Breakdown
340 W 11th Street ›
RTU-1 — Roof West ›
1 crit
HP-3 — Floor 4 ›
1 warn
10 E 38th St
All good
View Dashboard →
Day 30
First report: something you can actually show someone.

A full picture of month one: what was flagged, what was fixed, what's running clean. The first report you can hand to a building owner and say: here's what we've been doing, and here's the proof.

First Quarter

You're dispatching smarter.

You've got baselines. Your team uses the data before every site visit. You're the contractor who shows up knowing things and your customers notice.

Second Quarter and Beyond

A track record you can point to.

At 90 days you have patterns. At 6 months you have documented wins: issues caught early, callbacks avoided, customers who trust you more because they can see what you're doing.


Site Visits and Reporting

Log the work. Show the proof.

When work happens, techs log it directly in Sidekick. Everyone stays in the loop without anyone having to chase it down.

Step 1

Log the visit

Tech marks the job in progress. Service manager sees it in real time — no check-in call needed.

Step 2

Add field notes

Document what was found and what was done. Notes attach to the asset and build a maintenance history over time.

Step 3

Mark it complete

When the job's done, mark it complete. If you're subscribed, this triggers a before/after report for everyone who needs it.

Health Score — Before
Critical
RTU-1, pre-service
Health Score — After
Good
RTU-1, post-service
Compressor Temp
244° → 142°F
Back in safe range

Customer data anonymized.


Compatible Equipment

Works on most commercial heat pumps and air conditioners.

Sidekick installs on most refrigerant-based systems with a compressor: from 0.5 to 75 tons. If it has a compressor and a refrigerant circuit, Sidekick can monitor it.

Rooftop Units
Packaged single and multi-zone units, typically serving one or more floors from above
VRF / VRV Systems
Variable refrigerant flow systems with one outdoor unit serving multiple indoor zones
Split Systems
Mini-splits, ASHPs, WSHPs — single and multi-head configurations
PTAC / PTHP
Packaged terminal units common in hotels, apartments, and office perimeters
Works with equipment from
Bosch· Carrier· Daikin· Friedrich· Lennox· LG· Mitsubishi· Samsung· Trane· York· and more

Not compatible with heating-only equipment (furnaces, boilers) or commercial refrigeration systems. Not sure? Ask us →


FAQ

Questions worth asking.

The things customers usually want to know before getting started.

What issues does Sidekick detect?

Sidekick helps catch HVAC problems before they become expensive failures. That includes refrigerant undercharge, compressor overheating, short cycling, abnormal runtime behavior, and systems wasting energy or struggling to keep up.

In short: the kinds of issues that usually turn into truck rolls, unhappy tenants, or compressor replacements.

What's the difference between Sidekick Pro and Sidekick Max?

Sidekick Pro is designed for core equipment health monitoring on most single-compressor heat pumps and air conditioners.

Sidekick Max builds on that with expanded sensing and diagnostics for larger or more complex systems, including multi-compressor equipment and filter pressure monitoring.

Do you have case studies?

Yes. Our case studies walk through real customer outcomes — issues found, work generated, and what the before/after data looked like.


Less guessing. Fewer surprises.

For the first time, the contractor and the building owner are looking at the same information: before there's a problem, not after. That's what Thalo is built for.